
Japan’s Small Enterprise Mutual Aid scheme is not automatically the best investment for every eligible person. Current tax relief, how long you can continue, tax on the eventual benefit and your willingness to accept stock-market losses all matter.
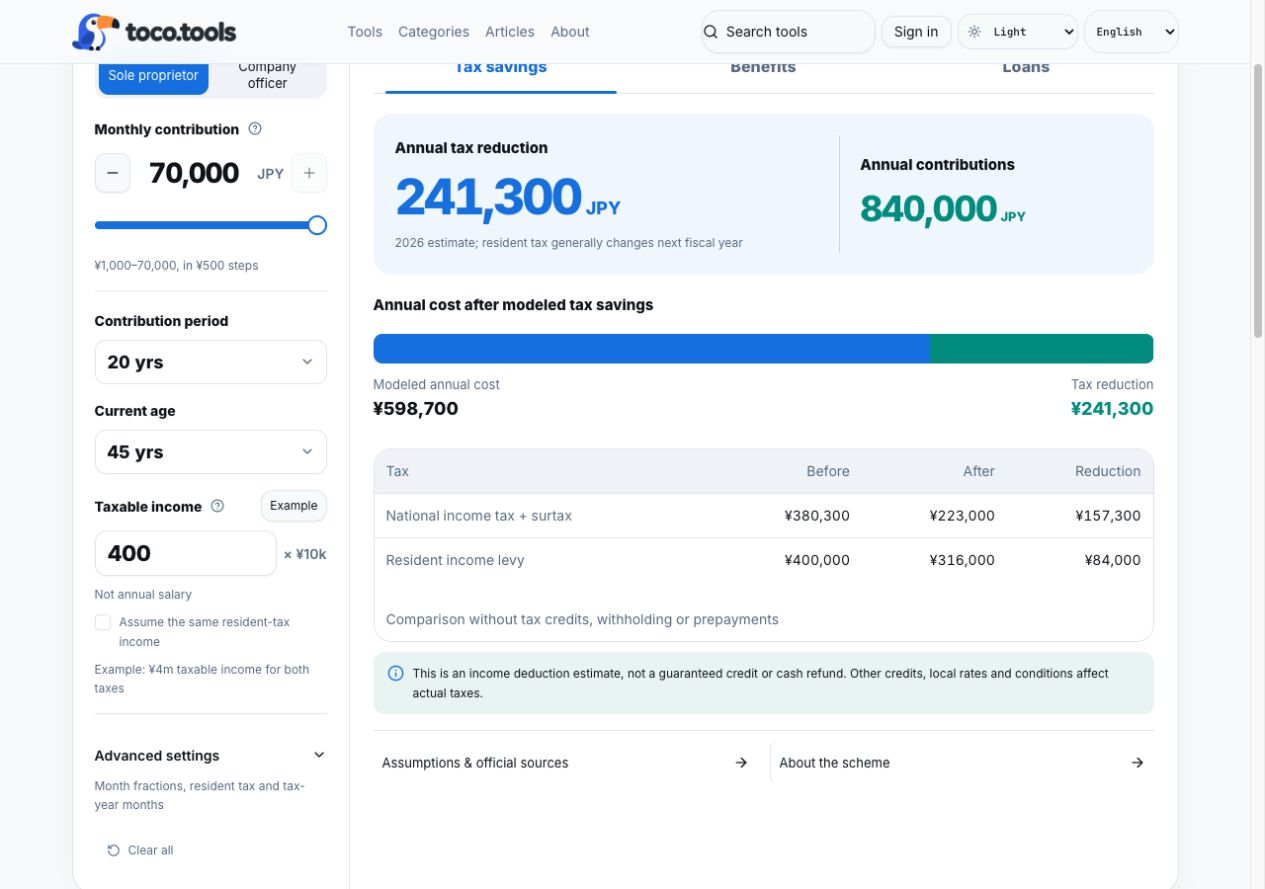
In this example, ¥70,000 monthly mutual aid contributions have approximately the same after-tax household cost as ¥49,892 monthly NISA investments. After 20 years, the investment calculation produces about ¥16.31 million at 3% or ¥20.25 million at 5%, compared with a gross mutual aid B benefit of ¥18.61 million. Higher long-term stock returns can outweigh contribution tax relief, but neither returns nor the value on the date you need the money are guaranteed.
Official sources were checked on November 5, 2026. Scheme facts, historical index statistics and hypothetical assumptions are distinguished below. Japanese official guidance applies to this Japanese scheme.
Match the household budget after contribution tax relief
Putting ¥70,000 into both alternatives and adding tax savings on top would compare different household costs. Instead:
| Item | Assumption |
|---|---|
| Mutual aid member | Sole proprietor, age 45 to 65; 20 years with unchanged contributions and no missed payments |
| Monthly / annual mutual aid contributions | ¥70,000 / ¥840,000 |
| Taxable income before this deduction | ¥4,000,000 each for national and resident income taxes |
| Annual contribution tax relief | ¥241,300 |
| Annual household cost after relief | ¥598,700 |
| NISA monthly / annual contribution | ¥49,892 / ¥598,704 |
| Total NISA principal over 20 years | ¥11,974,080 |
Rounding the monthly investment to whole yen makes the NISA alternative ¥4 more expensive per year. Both start with zero initial capital. Investments occur at month-end, using the monthly rate equivalent to an effective annual rate.
Tax relief uses 2026 national rates and rounding rules, plus a 6% municipal and 4% prefectural resident income levy, each rounded down to ¥100 as in this official local calculation. Other deductions are already reflected in the ¥4 million taxable-income assumption. Tax credits, withholding, advance payments and local differences are excluded. Income and the 2026 tax model are held fixed for comparison, not forecast to remain unchanged for 20 years. The real delay before resident tax relief is also normalized into a monthly budget rather than reproduced as cash-flow timing.
Do not add 20 years of tax savings to the mutual aid benefit again. They are already reflected in the smaller NISA contribution. We assume no previous NISA allowance usage and an eligible product. The ¥11.974 million principal is below even the growth-investment lifetime cap of ¥12 million; the roughly ¥0.60 million annual contribution is below the accumulation allowance of ¥1.2 million. Actual fund eligibility must be checked separately. Financial Services Agency NISA guidance
Mutual aid benefits depend on the claim reason
At ¥70,000 monthly for 20 years, the current statutory basic amounts are:
| Item | Gross amount, JPY |
|---|---|
| Contributions paid | 16,800,000 |
| Benefit A | 19,504,800 |
| Benefit B: the old-age comparison used here | 18,611,600 |
| Quasi-benefit | 16,936,500 |
| Voluntary cancellation payment | 16,800,000 |
Sources: SMRJ claim reasons and amounts and the statutory benefit table. Supplementary benefits, receipt taxes and settlement of outstanding loans are excluded. A and B are not freely selectable investments: membership status and the actual claim event determine the category. Old-age benefit eligibility requires age 65 or older and at least 180 paid months. Company officers may also qualify for the scheme, but their resignation and company-dissolution claim events differ from sole proprietors. See the official handbook.
The comparison uses mutual aid before receipt tax and NISA with domestic investment gains tax-exempt within its rules. Mutual aid receipt tax depends on the method, age and other retirement benefits, and is not calculated here. This favors mutual aid; a higher displayed mutual aid amount does not establish a higher actual after-tax outcome. SMRJ tax treatment
Hypothetical annual returns of 0%, 3%, 5% and 7%
These rates are comparison assumptions, not estimated expected returns. The calculation uses a constant return, without separately modeling fund charges, trading costs, exchange-rate movements, inflation or foreign taxes.
| Hypothetical effective annual return | NISA value after 20 years, JPY |
|---|---|
| 0% | 11,974,080 |
| 3% | 16,307,422 |
| 5% | 20,246,397 |
| 7% | 25,322,005 |
The 3% example is below the gross ¥18,611,600 B benefit; 5% and 7% are above it. Stock investing can outweigh the contribution deduction under these assumptions. That does not establish that it will always do so.
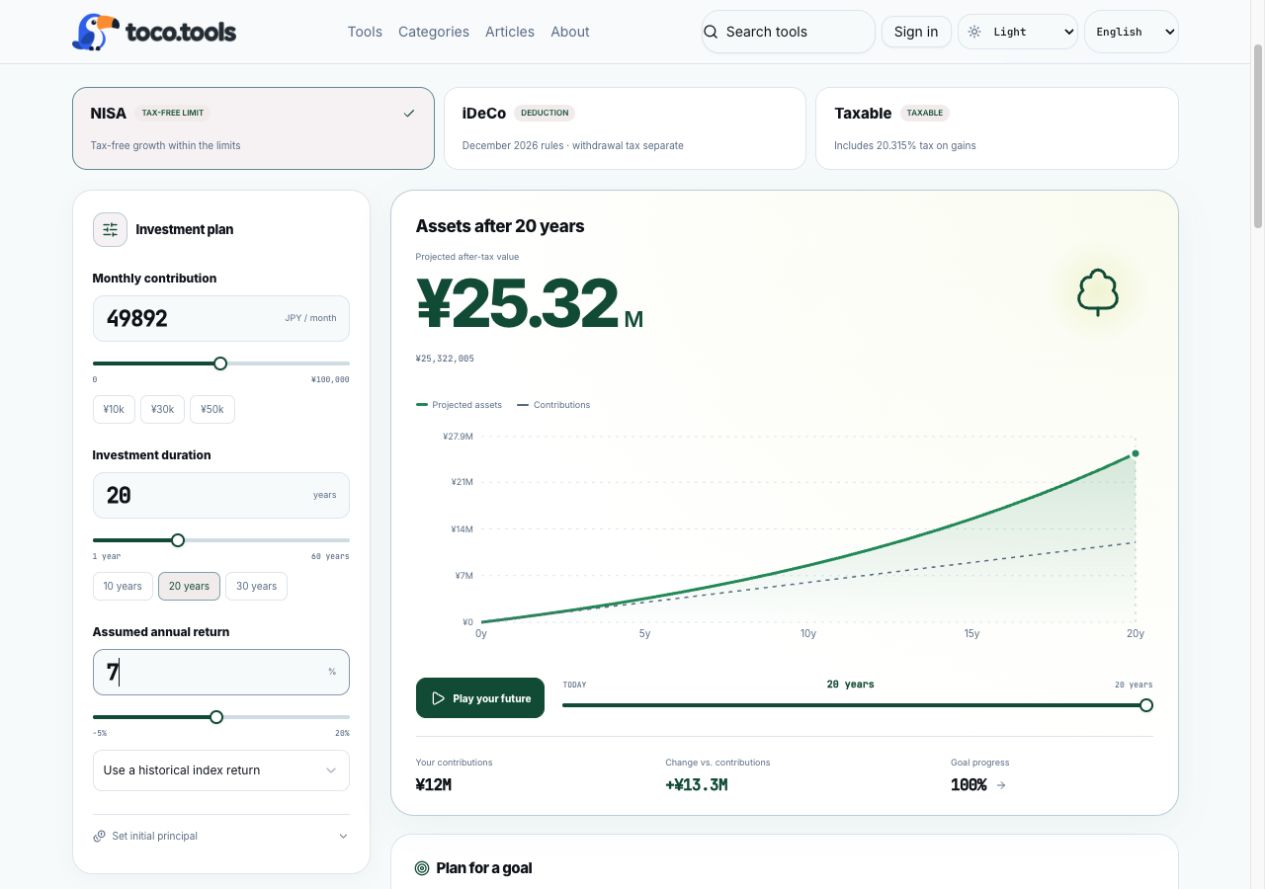
Open the prefilled 7% example, try 3% or try 5%. The ¥18,611,600 goal in these links is the gross mutual aid B amount, not an after-tax break-even target.
What about Orukan, the S&P 500 and Nasdaq-100 history?
Index providers publish the following long-run figures. All are USD statistics, with different periods and dividend conventions. They are not a same-period performance ranking. The final value column mechanically assumes that each historical number becomes a constant future JPY annual return for 20 years. It is neither a historical contribution backtest nor a forecast.
| Reference index | Official historical annual rate | Period | Basis in USD | Hypothetical 20-year value, JPY | Official source |
|---|---|---|---|---|---|
| All Country reference (MSCI ACWI) | 8.83% | 1987-12-31〜2026-10-30 | MSCI ACWI gross total return, used as an All Country / Orukan reference. Includes backfilled data before its May 1990 launch; not the fund's JPY return. | 31,249,185 | MSCI |
| S&P 500 | ≈10% | 1957-03-04〜2025-06-30 | Since launch, including dividends. The official brochure gives an approximate 10%. | 35,835,389 | S&P Dow Jones Indices |
| Nasdaq-100 | 14.25% | 1985-01-31〜2024-12-31 | Official compound annual return since launch. Dividend treatment is not specified in the article. | 59,704,563 | Nasdaq |
Mitsubishi UFJ Asset Management describes the Orukan fund’s benchmark as MSCI ACWI including dividends and converted to yen. The 8.83% above is a USD gross total-return index statistic, not the JPY fund’s performance. It includes backfilled data before the index’s May 1990 launch. The S&P 500 figure is the approximate dividend-inclusive return on page 5 of its official brochure. Nasdaq’s article gives a 14.25% compound annual return without specifying its dividend treatment.
MSCI ACWI reference: assume 8.83%
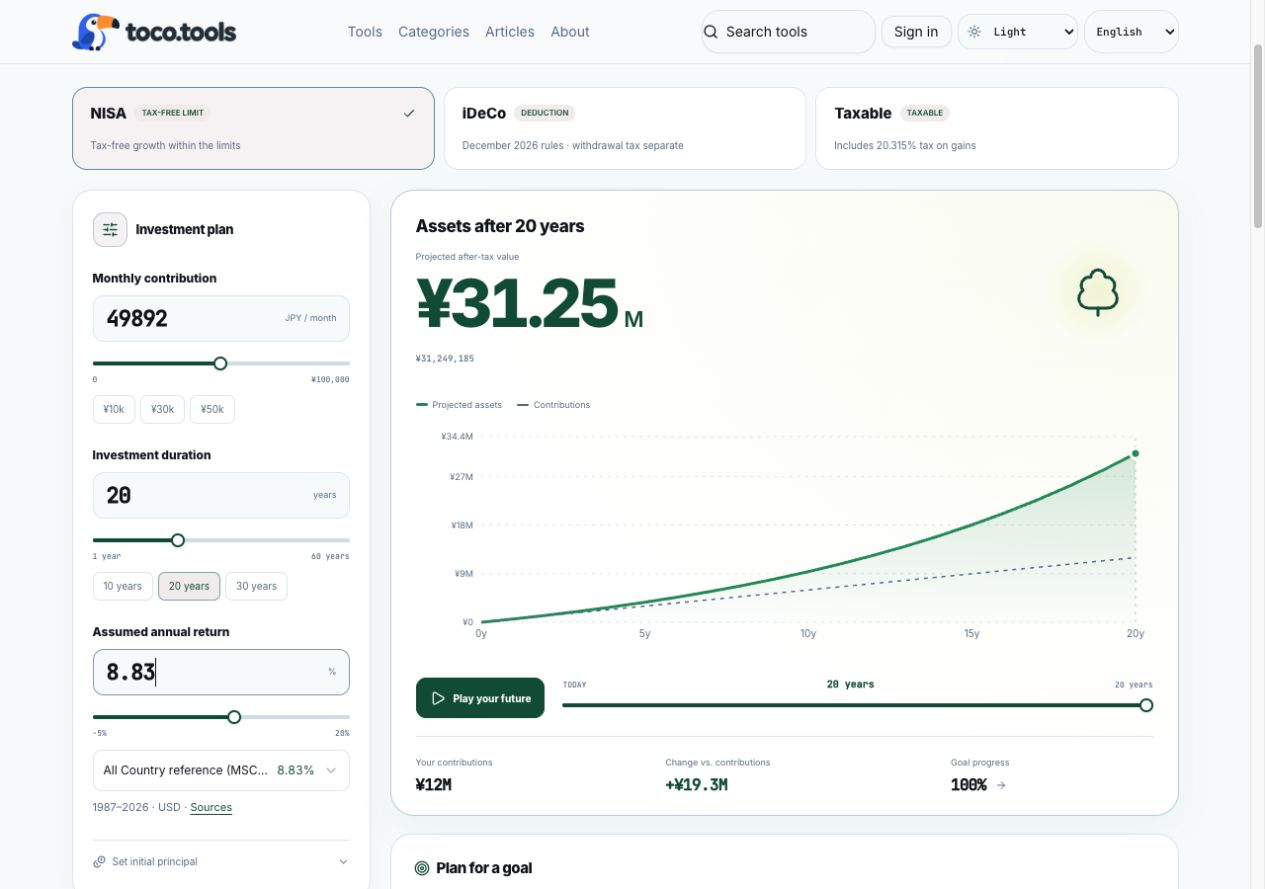
Open the prefilled 8.83% example. This is not a forecast of the Orukan fund’s JPY result.
S&P 500 reference: assume approximately 10%
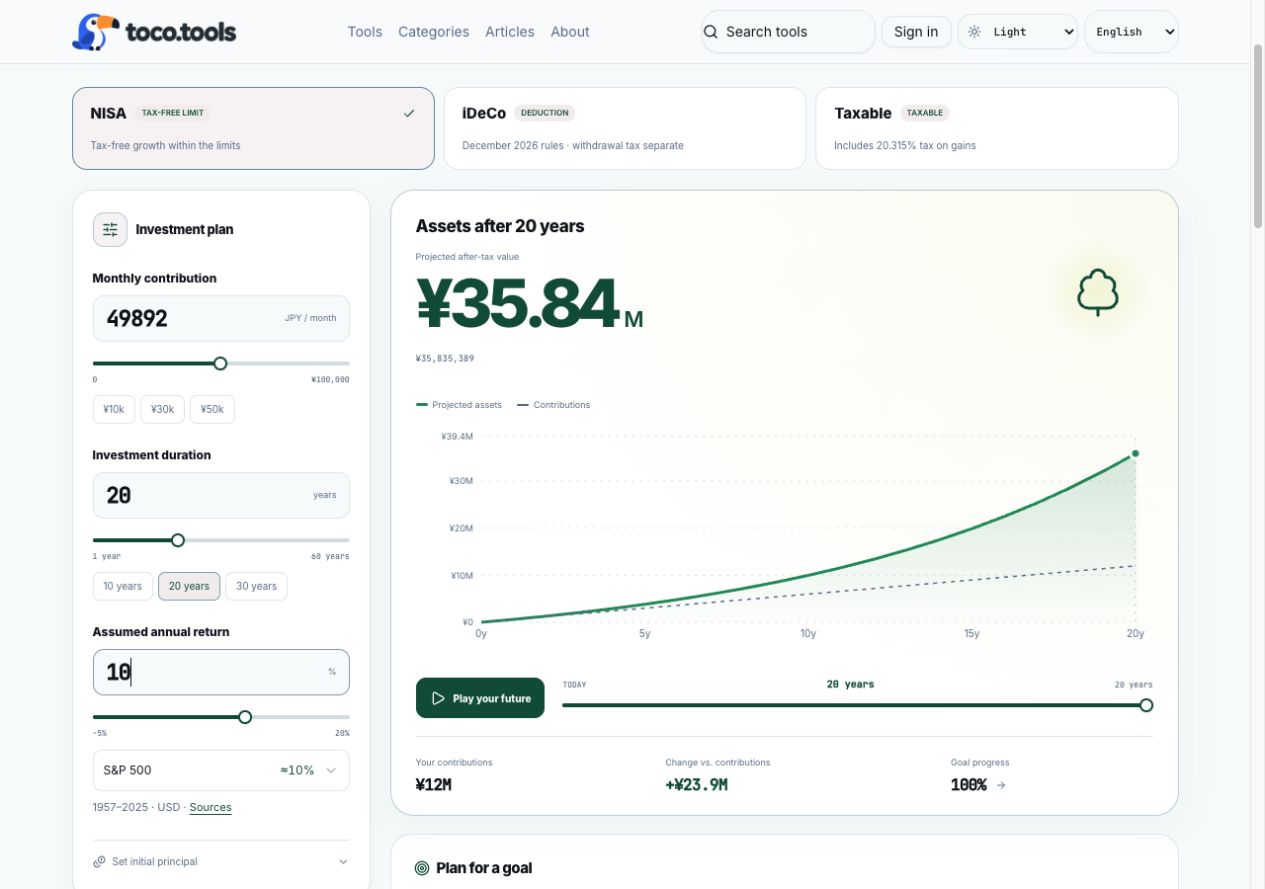
Open the prefilled 10% example. It is a sensitivity calculation using a historical approximation, without reproducing fund costs or currency movements.
Nasdaq-100 reference: assume 14.25%
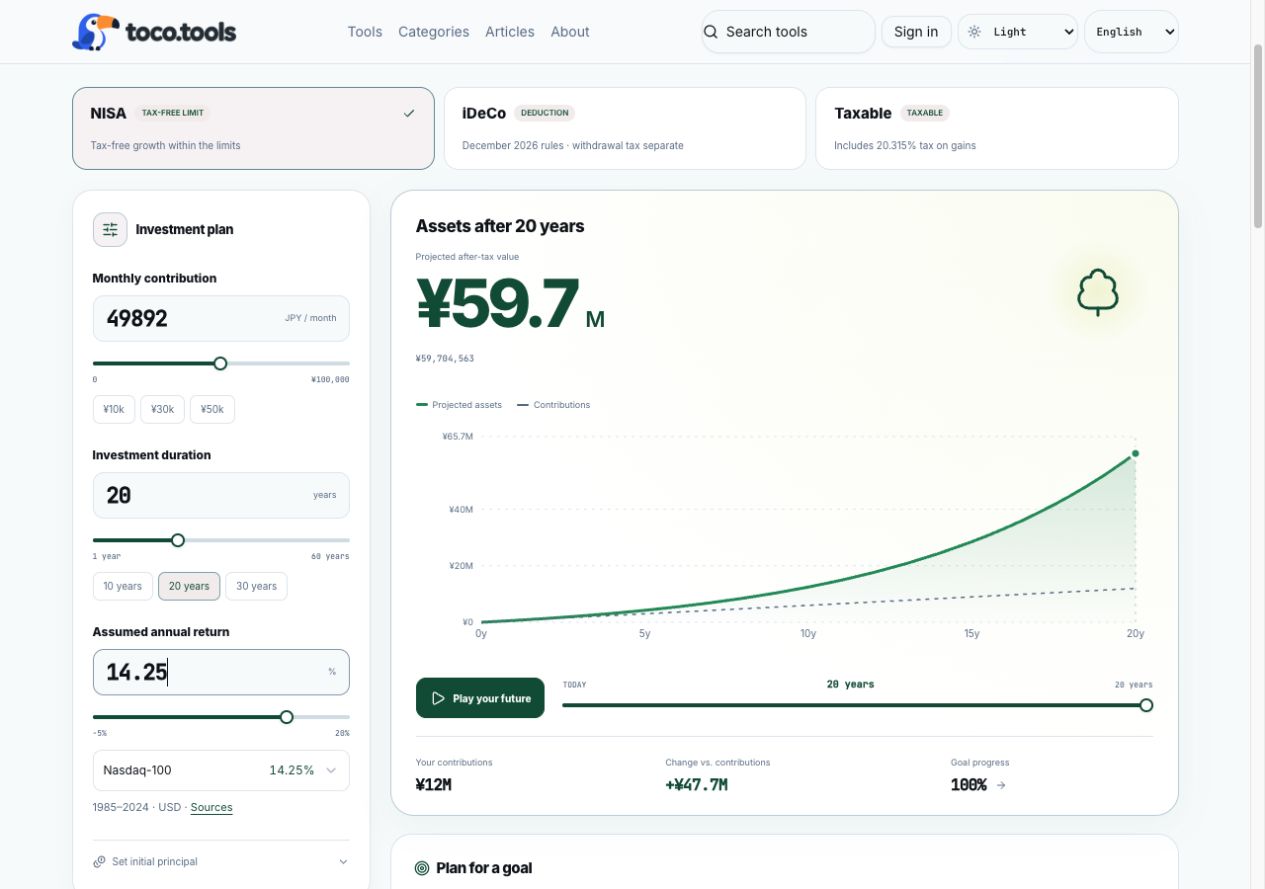
Open the prefilled 14.25% example. Assuming a high return continues for decades has a very large mathematical effect. Past performance does not establish that continuation.
Crashes and the value of a retirement reserve
The official MSCI factsheet reports an ACWI maximum drawdown of 58.06%, from October 31, 2007 to March 9, 2009. A broadly diversified stock index has experienced a substantial loss.
To illustrate magnitude, apply that percentage once at the very end of our constant-7% scenario. ¥25,322,005 becomes ¥10,620,049. This is not a reconstruction of historical contribution returns or an estimated crash probability. It simply applies a USD index drawdown percentage to a hypothetical JPY balance, showing how a crash immediately before withdrawal can change the result.
Mutual aid basic benefits follow statutory amounts based on the claim event, paid months and contributions, rather than daily market sale prices. That distinction can support keeping part of retirement funding separate from equities. It is not equivalent to a principal-guaranteed bank deposit. Voluntary cancellation before 20 years returns less than contributions; contribution changes can cause a shortfall even beyond 20 years. A/B benefits are not paid with fewer than six paid months, and quasi-benefits/cancellation payments with fewer than 12. Inflation’s effect on future purchasing power is also excluded from the tables. SMRJ benefits and cancellation guidance
Loans are useful, but investment profits are a separate issue
The official general-loan conditions cover business, business-related and living expenses, without collateral or a guarantor. You cannot join and immediately borrow every yen paid in: conditions include at least 12 qualifying paid months excluding advance months, and a notified loan limit.
The published general-loan rate is 1.5% annually as of our check. We did not find an explicit statement in the reviewed official guidance permitting ordinary stock or investment-fund purchases. Confirm the intended use with SMRJ and the handling institution before considering it. The following arithmetic does not establish permission.
For a ¥1 million, 12-month loan, ¥15,000 interest is paid in advance, leaving ¥985,000 available to invest. Assume repayment of ¥1 million at maturity, with investment taxes, stamp duty and trading costs excluded:
| Hypothetical one-year investment return | Assets remaining after repaying ¥1 million, JPY |
|---|---|
| 0% | -15,000 |
| +5% | +34,250 |
| -20% | -212,000 |
In this advance-interest example, a 5% investment return leaves ¥34,250, rather than simply ¥1 million × (5% − 1.5%) = ¥35,000. Taxes and costs can further change the outcome. Losses do not cancel the debt. Six- and twelve-month loans require lump-sum principal repayment, so a 20-year equity strategy does not match a 12-month loan, and refinancing is not automatically guaranteed. Contribution tax relief does not make leveraged investing safe. Official repayment and interest terms
When does joining deserve consideration?
These are decision criteria drawn from the conditions above, rather than a universal recommendation:
| Factor | More supportive conditions | Reasons for caution |
|---|---|---|
| Eligibility | You meet the sole proprietor, officer or other eligible-member conditions | You assume ordinary employee status alone qualifies |
| Current taxation | There is taxable income against which the deduction provides relief | Little taxable income means limited immediate relief |
| Cash and duration | You can sustain contributions until an appropriate retirement or claim event | You may need voluntary cancellation after a few years or lack working capital |
| Investment objective | You value retirement funding separate from market sale prices | You prioritize growth and can accept market losses |
| Receipt taxes | You can plan alongside other retirement payouts | You assume contribution deductions determine the final net benefit |
Check eligibility in the official handbook. Using mutual aid and NISA together is also possible within your resources; the decision need not be all-or-nothing. First account for necessary business and living cash, then compare mutual aid tax relief and benefits with investment scenarios you can change yourself.
For year-end contribution timing, read our official-source explanation of prepayments, 13 months and the ¥1.68 million example.