
A 4% distribution yield minus 1.5% borrowing interest is not automatically a 2.5% profit. In this article's model, an unchanged sale price leaves roughly ¥16,400; a 10% price decline instead produces a loss of roughly ¥82,100.
We compare the incremental cash outcome against remaining a mutual aid member without borrowing. Sources were checked on November 8, 2026. Published product facts, past distributions and hypothetical future outcomes are identified separately.
Confirm the permitted use of the loan first
SMRJ's general-loan conditions describe business working capital, other business-related funds and living expenses. The public official documents checked did not expressly authorize ordinary stock or ETF investing. Confirm the intended use with SMRJ and the lending institution. The calculations below do not establish permission. The mention of acquiring shares under a separate business-succession loan also does not authorize ordinary portfolio investing.
The cash available is not necessarily the face value of the loan
At the check date, the published general-loan rate is 1.5% annually. Loans of ¥1 million or less offer six or twelve months, with upfront interest and principal repaid at maturity. The example assumes a new twelve-month loan, no existing borrowing and a notified limit of at least ¥1 million.Official terms
| Assumption | Amount or condition |
|---|---|
| Loan principal and maturity repayment | ¥1,000,000 |
| Upfront interest | ¥15,000 |
| Amount invested after paying interest from the loan | ¥985,000 |
| Tax on distributions | 20.315% |
| Trading costs, stamp duty and interest on idle cash | Assumed zero |
| Distribution reinvestment and refinancing | None |
The simplified domestic withholding/no-return model excludes tax offsets and refunds, foreign tax, NISA and any deduction of borrowing interest from dividend income. NTA specifies conditions under which interest is deductible and excludes interest related to dividends for which no-return treatment is chosen.Tax rate / Interest treatment
Tax is applied once to annual distributions for this illustration. It does not reproduce per-payment national/local tax rounding, record dates, payment dates or receivable distributions at maturity. Only cash received can fund a repayment.
Separate distributions from the sale-price change
All yields and price changes in this table are hypothetical, not forecasts for the named products. Price change excludes distributions. All distributions are assumed received within the year; no loss-related tax refund is credited. Amounts are yen.
| Assumed gross distribution yield | Sale-price change | Net distributions, approximate | Profit/loss after repaying principal |
|---|---|---|---|
| 2% | 0% | 15,698 | +698 |
| 2% | -5% | 15,698 | -48,552 |
| 2% | -10% | 15,698 | -97,802 |
| 2% | -20% | 15,698 | -196,302 |
| 4% | 0% | 31,396 | +16,396 |
| 4% | -5% | 31,396 | -32,854 |
| 4% | -10% | 31,396 | -82,104 |
| 4% | -20% | 31,396 | -180,604 |
| 6% | 0% | 47,094 | +32,094 |
| 6% | -5% | 47,094 | -17,156 |
| 6% | -10% | 47,094 | -66,406 |
| 6% | -20% | 47,094 | -164,906 |
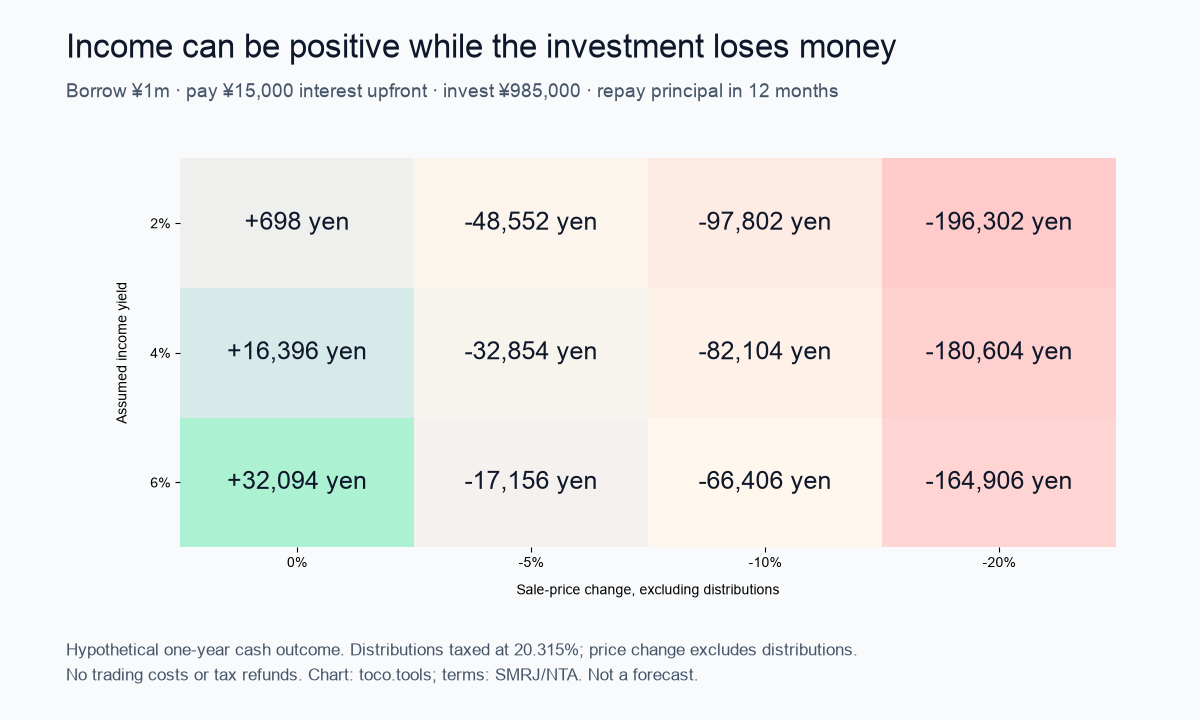
With unchanged prices and no other costs, the gross distribution break-even yield is approximately 1.91%: 15,000 ÷ 985,000 ÷ 0.79685. Price movements change the conclusion. Halving a 4% distribution to 2% leaves only about ¥698 even with an unchanged sale price.
Seven comparators and why the additional three matter
Repaying principal makes liquidity and the drivers of price changes as relevant as distributions. These products provide concrete comparisons; they do not receive a single ranked recommendation.
| Official product example | What to compare |
|---|---|
| Japanese REIT ETF, 1343 | Domestic property exposure, distributions and sale-price losses; individual REITs add issuer concentration |
| Japanese high-dividend equity ETF, 1489 | Equity prices and distributions; the label does not fix future income |
| Individual JGBs, including floating ten-year bonds | Redemption restrictions and adjustments rather than ETF market sales |
| Long US Treasury ETF, currency-hedged 2621 | Long-duration bond-price movements; different from personally holding a bond to maturity |
| Additional: Ultra-short yen bond ETF, 502A | Primarily high-grade bonds and commercial paper with one year or less remaining; fees matter relative to low income |
| Additional: Ultra-short US Treasury ETF, 133A | One-to-three-month US Treasury exposure translated into yen; short duration does not fix the yen value |
| Additional: Yen time deposits | A one-year, yen-denominated benchmark; a net rate below borrowing cost does not produce a positive spread |
502A was established in January 2026; its official twelve-month yield was shown as “--” at the check. That is neither zero nor permission to annualize its first distribution into a quoted yield. Trading 133A in yen also differs from hedging its underlying currency exposure. Dates and yield definitions differ, so the seven products are not placed in a yield league table.
A hypothetical 0.5% one-year yen deposit, taxed at 20.315% without early withdrawal, earns roughly ¥3,924 on ¥985,000 and leaves a loss of about ¥11,076 after loan interest. The 0.5% is an assumption, not a quotation of a bank's current rate; check the bank's official rate before using actual terms.
Reproduce the 1343 and 1489 example in valid trading units
The following uses official November 6, 2026 closing prices and the latest four declared distributions available by the check date. The scenario assumes these distributions repeat during the next year. It is neither a realized historical investment result nor a forecast.
| Official input | 1343 | 1489 |
|---|---|---|
| Closing price per unit | ¥1,800 | ¥3,390 |
| Trading lot | 10 units | 1 unit |
| Four distributions, per 100 units | ¥2,310 + 2,550 + 2,370 + 2,060 | ¥800 + 3,800 + 900 + 4,900 |
| Distribution determination dates | 2025/11/10; 2026/2/10, 5/10, 8/10 | 2026/1/7, 4/7, 7/7, 10/7 |
| Four-distribution total per unit | ¥92.90 | ¥104 |
Sources: 1343 price, lot and distribution history / 1489 equivalent data. A distribution stated per 100 units must not be multiplied as though it were per unit. We purchase whole trading lots and retain uninvested cash.
| Code | Price/unit | Units bought | Invested | Idle cash | Gross distributions | Flat-price P/L | Price −10% P/L |
|---|---|---|---|---|---|---|---|
| 1343 | 1,800 | 540 | 972,000 | 13,000 | 50,166 | +24,975 | -72,225 |
| 1489 | 3,390 | 290 | 983,100 | 1,900 | 30,160 | +9,033 | -89,277 |
For 1343, the model invests ¥972,000 and retains ¥13,000. Profit is sale proceeds plus retained cash plus net distributions minus the ¥1 million principal repayment. Interest was already removed from starting cash, so it must not be subtracted a second time here. Fund expenses reflected in market/NAV and distribution data are not deducted a second time either; brokerage charges remain a separate excluded cost.
Bonds also need to match the yen repayment date
Individual JGBs generally cannot be redeemed within a year of issue. Subsequent early redemption deducts an amount equivalent to the previous two after-tax coupon payments. Different loan and issue dates can therefore prevent using redemption proceeds for a twelve-month repayment.MOF conditions Our loan-funded individual JGB article checks dates, minimum purchase units and possible tax offsets separately.
2621 targets US Treasuries with over twenty years remaining. Its official 2022 total return was −32.99%, a past fund return including reinvestment of pre-tax distributions and after fund expenses. It is not a price-only decline. Adding distributions again would double-count them, and the figure is not a forecast of future losses.Manager's return data and definitions
For mutual funds generally, a distribution can include a return of the investor's capital. Evaluate distributions together with NAV movements. Do not assume identical tax treatment for ordinary mutual-fund capital repayments and individual REIT distributions.FSA explanation
Do not count contribution tax savings twice
The mutual aid deduction relates to contributions paid. With identical contributions it is common to both the borrowing and no-borrowing cases, so it is not added again to the investment's incremental profit.NTA deduction
Covering interest with distributions still leaves ¥1 million of principal due. Refinancing requires procedures and is not assumed to continue automatically on unchanged terms.SMRJ refinancing explanation Test the combined conditions of a sale-price loss, reduced distributions and a need for business cash at maturity.
The no-borrowing baseline has zero incremental investment profit/loss. For investing only cash freed by contribution deductions, see our mutual aid versus NISA comparison. Receipt tax is covered in the retirement and pension deduction article. The mutual aid simulator compares contributions, benefits and loan interest.
Calculation method and reproducible data
Investable cash = loan principal − upfront interest. Net income = invested cash × assumed distribution yield × 0.79685. Profit/loss = sale proceeds + net income + idle cash − principal repayment. Distribution cuts affect the income component only.
The calculation CSV contains yield assumptions, price changes, distributions and resulting profit/loss. The chart and article use the same data, independently checked with decimal arithmetic. “Profit” means the incremental one-year cash result under these assumptions; it does not establish permitted loan use, a final tax liability or future investment results.